
Trading Guide: Technical Analysis

Disclaimer
Some links may earn us a small commission at no extra cost to you.
Click here to read our full affiliate disclosure.
Disclaimer
We believe in complete transparency with our audience.
Some links may earn us a small commission at no extra cost to you.
Please know that we only recommend products/services we have personally used, thoroughly researched, and genuinely believe can benefit our audience.
We are immensely grateful for every click and purchase you make through these links. Thank you for being a part of our community and for your continued support!
Click here to read our full affiliate disclosure.

Updated on 27/10/2025
Success in trading heavily depends on understanding the language of the markets. This language (spoken through charts, patterns, and indicators) is known as Technical Analysis.
In this guide, we’ll explore how Technical Analysis helps traders gain the ability to make informed trading decisions and unlock profitable opportunities.
If you're curious about how to predict price movements, how to find the right times to jump in or out of a trade, and generally boost your trading skills, you're in the right place.
Why is Technical Analysis Important?

Incorporating technical analysis into your trading strategy allows you to gain a practical understanding of the interplay between price, time, and human psychology, thus improving your overall ability to remain consistently profitable.
Here's why:
1. Predicting Price Movements:
With the help of patterns and trends, technical analysis helps you foresee potential price shifts, enhancing overall strategy effectiveness.
2. Risk Management:
Setting precise entry and exit points, establishing stop-loss orders, and determining risk-reward ratios, helps safeguard capital and minimise potential losses due to market volatility, contributing to a stronger and more sustainable trading approach.
3. Market Psychology:
Human emotions and psychology can influence forex markets. Therefore, understanding this psychology becomes a practical tool for making strategic decisions.
Technical analysis helps you with that since it uncovers the collective mindset of traders.
4. Adaptability:
Adaptability is a key factor in maintaining success over the long term as a trader because the market is dynamic.
Technical analysis provides a system that allows traders to adjust their strategies seamlessly as market conditions evolve.
Core Principles of Technical Analysis

A. Price Charts
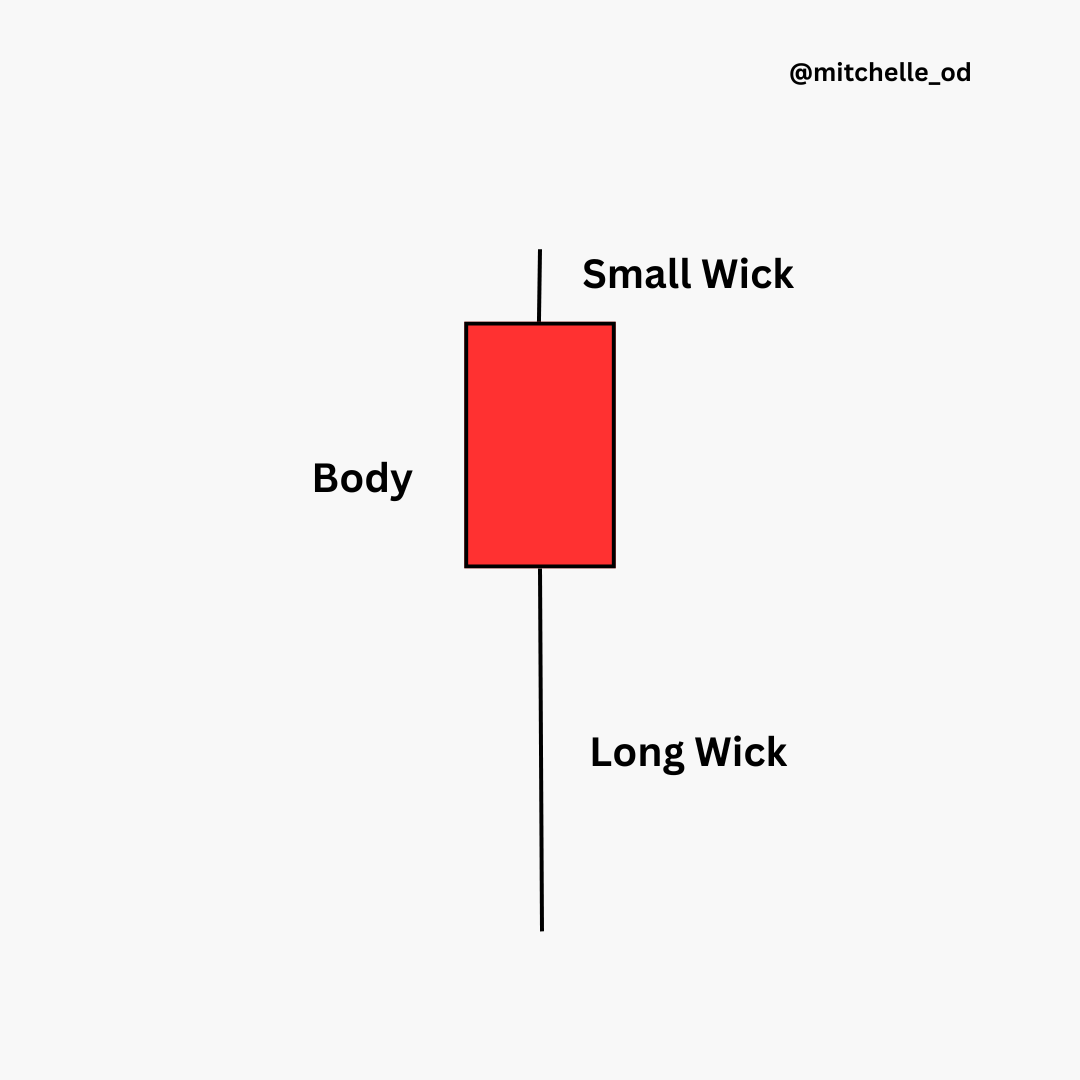
1. Candlestick and Price Patterns:
The language of technical analysis can be represented visually through candlestick charts.
Patterns formed from a collection of candlesticks provide insights into market sentiment, and recognising these patterns enables traders to identify potential reversals or continuation of trends in the market.
Candles and candlestick patterns to take note of:
i. Pinbar: This is a reversal candle. It indicates a rejection has taken place, initiated at the top by the buyers and then pushed lower by the sellers.

ii. Marubozu: This candle indicates either a strong bullish or bearish momentum, meaning that the price is moving in only one direction.

iii. Hanging man: This candle is opposite in appearance to the pinbar. It indicates increasing selling interest (when it forms at the top of an uptrend), and can foreshadow a potential reversal or a market top.
iv. Doji: This candle is a neutral and indecision candle. It indicates that the price moved up and down but closed right where it opened.

v. 3 Inside Up: This is a reversal pattern. The body of the second candle is smaller than the first, indicating a pause or an end. The third candle shows the change in momentum.

vi. Engulfing: This is often a reversal signal. It indicates a high momentum in the opposite direction. The second candle shows the shifting power.

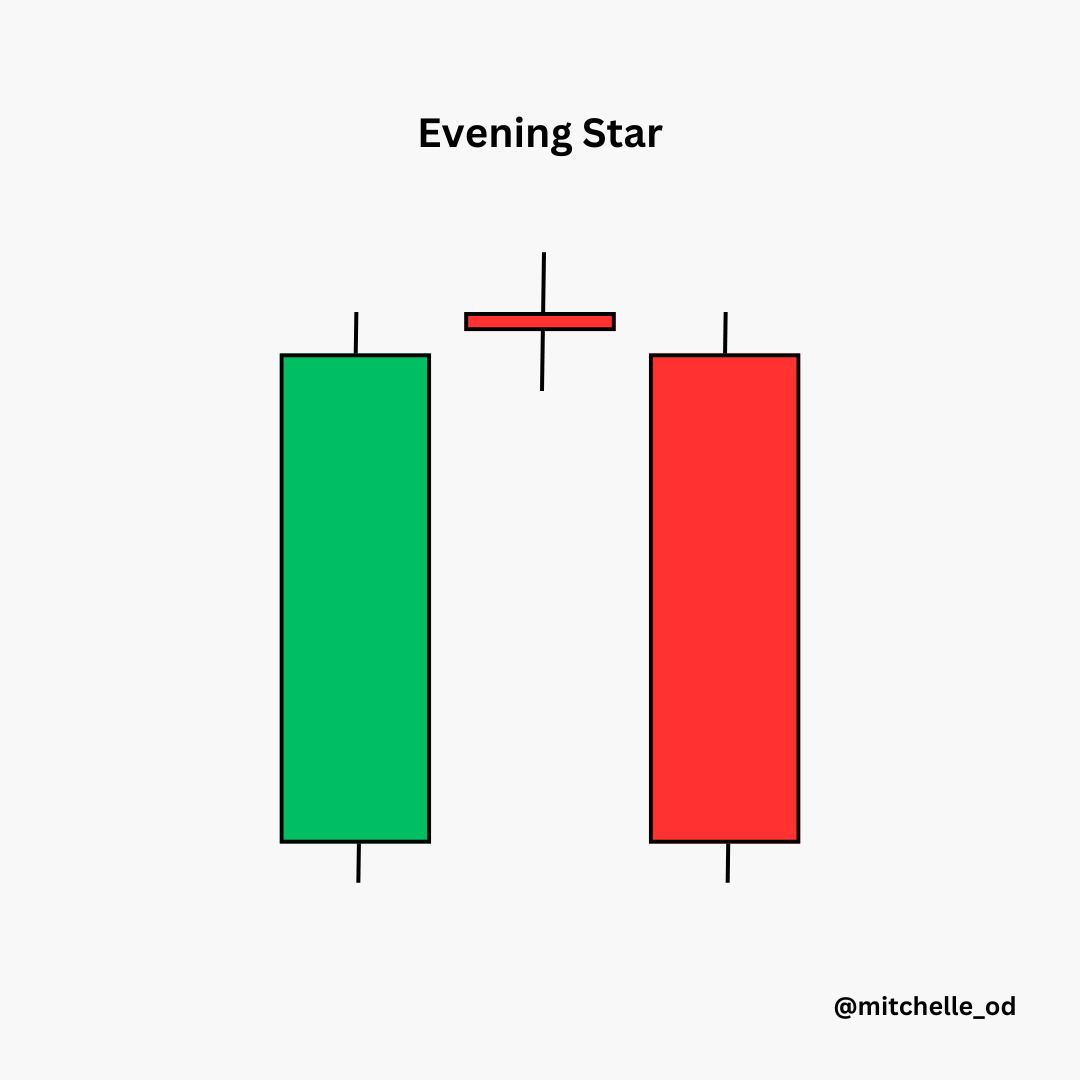
vii. Evening star: Another reversal candle formation. The second candle is a doji indicating a pause, and the third candle is strong. This confirms the change in direction.
Note: Sometimes the second candle can be a pinbar.
Price patterns to take note of:
i. Head and Shoulders: This is a bullish-trend reversal pattern. It’s a high-accuracy pattern that perfectly describes the exhaustion in a trend.
The head and shoulders pattern works on all markets, and is ideal if you want to trade breakouts or pullbacks.

ii. Inverse Head and Shoulders: This is the opposite of the head and shoulders. It is a bearish-trend reversal pattern and ideal if you want to trade breakouts or pullbacks.

iii. Wedge: This is a trend reversal pattern. It indicates that a previous trend is slowly coming to an end.
The wedge works on all markets and is ideal if you want to trade breakouts or pullbacks.

iv: Flag: This price pattern is like a wedge, and occurs during the continuation of a trend.
Flags indicate a temporary pause in a trend and are ideal for trend-following traders who want to trade pullbacks or breakouts.

v. Range/Rectangle: The direction of this pattern will depend on the context of the trend.
Price is extremely volatile within the range. Don’t trade within the range. It is safer to only trade the breakout or pullback.

vi. Triangle: This is usually a continuation pattern, and is only valid in a trend context. This pattern works on all markets, and is ideal for traders who want to trade breakouts or pullbacks.

vii: Cup and handle: This is also a trend continuation pattern. The handle foreshadows the continuation.
The cup and handle pattern occurs more frequently in stock markets. It is ideal for traders who want to trade pullbacks or breakouts.

Note: Price patterns come in variations. They will not look the same every time they occur. The markets are ever-changing.
Please study the different variations of these price patterns so that you can spot them even when they’re not “textbook perfect” (example shown in the image below).
In addition, before opening a position, always wait for the market to break out of a price pattern. That is when the price pattern becomes valid.

Analysis done via TradingView
2. Trendlines and Channels:
Connecting the highs or lows on a price chart creates a trendline. Channels consist of parallel trendlines and better capture price movement.
Understanding how to draw and analyse trendlines and channels, will further assist you in identifying trend direction, trend strength (depending on the angle of the trendline), potential breakouts, and trend reversals.
Note: Trendlines must have at least 3 touch points to be valid. When a candle closes beyond the trendline, it is no longer valid.

3. Support and Resistance Levels:
Support and resistance are key concepts in technical analysis. Support represents a price level where an asset often finds buying interest, preventing it from falling further.
Resistance, on the other hand, is a level where selling interest tends to emerge, preventing it from rising further. Recognizing these levels helps traders make decisions about entry, exit, and stop-loss points.

B. Indicators
1. Moving Averages:
Moving averages smooth out price data, creating a single flowing line that reveals the overall direction of the trend.
Traders use simple moving averages (SMA) or exponential moving averages (EMA) to identify trend direction, potential crossovers (indication of a shift in the trend), and areas of support or resistance.
Moving averages will remain valid as long as a candle does not close beyond the flowing lines.
This is ideal for support and resistance trading and pullback trading. Common moving averages include the 20MA, 50MA, 100MA and 200MA.

2. Relative Strength Index (RSI):
RSI is a momentum oscillator that measures the speed and change of price movements. RSI values range from 0 to 100 and help traders identify overbought or oversold conditions in the market.
RSI divergence occurs when price on the chart moves in the opposite direction of what the indicator is showing, meaning there is a loss of momentum, and this is usually a signal that a reversal will soon occur.
(I've attempted to highlight this using the green and red strokes in the following image.)
RSI is an ideal indicator for anticipating potential reversals or continuations.

3. Moving Average Convergence Divergence (MACD):
This indicator is a derivative of the moving average. MACD combines aspects of trend-following and momentum analysis.
It consists of two moving averages – the MACD line and the signal line. Crossovers between these lines provide signals for potential trend reversals or continuations.
Whenever the MACD is above the 0 line, look for long (buy) opportunities, and when it is below the 0 line, look for short (sell) opportunities.

By mastering these core principles of technical analysis, traders enhance their overall proficiency when trading.
Common Pitfalls in Technical Analysis
A. Overreliance on specific indicators
Technical analysis offers a diverse array of indicators, each with its strengths and limitations.
One common pitfall is the overreliance on a single indicator or a narrow set of indicators. Traders may fall into the trap of ignoring other valuable signals or fail to consider the broader market context.
Diversifying the use of indicators and understanding their interplay can provide a more comprehensive view of market conditions, reducing the risk of making decisions based on incomplete information.
B. Ignoring fundamental factors
While technical analysis is a powerful tool, it's essential to recognise its limitations, particularly when used alone.
Ignoring fundamental factors such as economic data releases, geopolitical events, or changes in interest rates can lead to a skewed analysis.
Successful traders understand the synergy between technical and fundamental analysis, and that utilising both approaches provides a more robust foundation for decision-making.
Related Blog Post: Trading Guide - Fundamental Analysis
Related Blog Post: How to Make Money Trading Forex
C. Emotional trading and the impact on analysis
Emotions play a significant role in trading, and allowing emotions to dictate decisions can undermine even the most thorough technical analysis.
Fear of loss or the desire for quick profits may lead to impulsive actions that deviate from a well-thought-out strategy.
It's crucial for traders to maintain emotional discipline, adhere to risk management principles, and not let fear or greed cloud their judgment.
Being aware of emotional biases and establishing a clear trading plan can help mitigate the impact of emotions on technical analysis.

Advanced Techniques for Technical Analysis
A. Fibonacci Retracement and Extension Levels
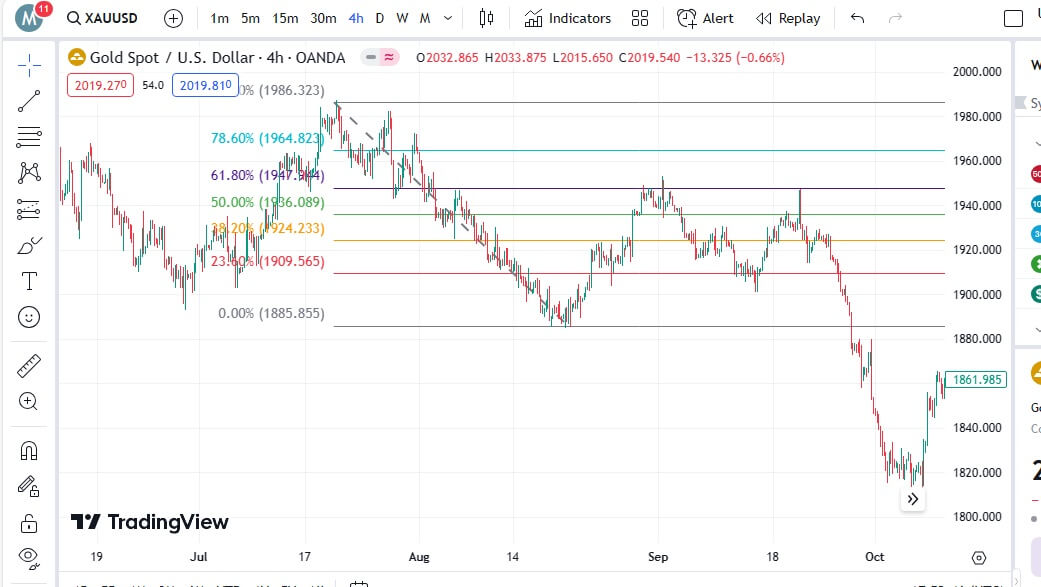
1. Fibonacci retracement: Fibonacci retracement levels are based on the mathematical ratios discovered by the famous mathematician Leonardo Fibonacci.
Traders use these levels to identify potential support and resistance levels during price corrections within an existing trend. The common retracement levels include 38.2%, 50%, and 61.8%.
Using the Fibonacci retracement tool on TradingView assists traders in pinpointing areas where price may reverse in the future, and continue in the direction of the overall trend.
The example below shows price reversed from the 61.8% Fibonacci level.
2. Fibonacci extension: Fibonacci extension levels are used to identify potential price targets when an asset is in an uptrend or downtrend.
Traders use extensions beyond 100% to project where the price may reach after a significant move. Popular extension levels include 127.2% (example shown in the image below), 161.8%, and 261.8%.
Utilizing Fibonacci retracement and extension levels enhances a trader's ability to identify strategic entry and exit points.

B. Elliott Wave Theory for Predicting Market Cycles
Elliott Wave Theory is a complex yet powerful tool for analysing market cycles and predicting future price movements.
Developed by Ralph Nelson Elliott, this theory suggests that market movements follow a repetitive pattern of waves.
The basic structure includes five impulsive waves (trend) and three corrective waves (counter-trend).
Traders using Elliott Wave Theory attempt to identify these patterns to anticipate the next market move and align their trades accordingly.
1. Impulse waves: These are the five waves that move in the direction of the prevailing trend, labelled 1, 2, 3, 4, and 5.
2. Corrective waves: Following the impulse waves, corrective waves (labelled A, B, and C) aim to counteract the overall trend, providing opportunities for traders to enter or exit positions.

The 3 Unbreakable Rules:
1. Wave 2 cannot retrace more than 100% of Wave 1.
2. Wave 4 cannot move into the territory of Wave 1.
3. Wave 3 cannot be the shortest amongst Waves 1, 3 and 5.
Note: This does not mean Wave 3 has to be the longest.

Analysis done viaTradingView
Advanced techniques like Fibonacci analysis and Elliott Wave Theory add depth to a trader's technical analysis toolkit.
However, it's vital to approach these methods with a solid foundation in basic technical analysis principles and to use them in conjunction with other tools for a comprehensive market analysis.
Staying Informed and Adapting to Market Changes
A. Keeping up-to-date with economic events and news:
1. Real-time awareness: Successful forex traders understand the significance of staying informed about economic events and news that can impact the markets.
This involves regularly monitoring economic calendars like forexfactory.com for releases of key indicators, central bank statements, and geopolitical developments.
2. Impact assessment: Traders should not only be aware of upcoming events but also understand how these events might influence the market.
Certain economic indicators, such as employment reports or interest rate decisions, can have a profound impact on prices. Being able to assess the potential consequences of these events is crucial for making informed trading decisions.
B. Continuous learning and staying updated on new technical analysis tools:
1. Educational resources: Trading is dynamic, and staying ahead requires a commitment to continuous learning.
Traders should engage with educational resources, attend webinars, read books, and participate in forums to deepen their understanding of technical analysis and stay well-informed about industry trends.
2. Adopting new tools: As technology evolves, new technical analysis tools and platforms emerge.
Traders should be open to adopting innovative tools that can enhance their analysis and decision-making.
This may include algorithmic trading, artificial intelligence, advanced charting platforms like TradingView, or advanced journaling platforms.

Image Source: TradeZella Website
C. Adapting strategies based on market conditions
1. Market analysis: Regularly reassessing market conditions is essential for effective trading.
Market dynamics can change due to economic shifts, geopolitical events, or changes in investor sentiment. Traders must adapt their strategies to align with the current environment.
2. Risk management: Adapting to market changes also involves reviewing and adjusting risk management strategies.
Traders should reassess position sizes, set appropriate stop-loss levels, and ensure that risk-reward ratios align with the current market conditions.
3. Flexibility: Successful traders are flexible and able to pivot when necessary.
This may involve adjusting trading timeframes, revisiting entry and exit points, or even temporarily stepping back from the market during periods of heightened uncertainty.
Traders who embrace a proactive approach to market changes position themselves for long-term success.

Final Thoughts
On the journey to becoming a successful trader, understanding and integrating technical analysis is a pivotal step.
Here are some key takeaways from this blog post:

Integrate the techniques covered above into your trading strategy, practice disciplined risk management, and continue learning to further enhance your proficiency.
Remember that adaptability is key. Stay informed and be flexible in your approach.
Trading may not be suited to all investors because of the high level of risk involved.
Do not trade with money you cannot afford to lose because losing trades are inevitable, no matter how much prior research you have done or how confident you are in your trade.


Trending
It's possible, even without an SSN.
Discover key qualities to consider when choosing right.
Learn what contributes to a successful business launch.

Deals & Promotions

You can also gain unlimited free access to Exclusive Content and Offers.

2026 © MitchelleO.D. All Rights Reserved.
Disclaimer: As an Amazon Associate, we earn from qualifying purchases. We may participate in additional affiliate networks or programs beyond Amazon.
Visit our Affiliate Disclosure Page to learn more.